Обновление процесса --- iTME (высокоточная пространственная платформа, Stereo-seq, HD) ткани анатомического клеточного окружения (CN)
Автор, Злой гений
Недавно студент спросил, почему процесс обновления и обновления компании требует так много контента?
Причина очень проста. Так называемое обновление процесса требует исследования и обобщения всех методов анализа, алгоритмов, сценариев использования, преимуществ и недостатков. Например, текущая космическая платформа включает Visium, Xenium, HD, Stereo-seq и сингл. -пространство ячеек Существуют десятки методов совместного анализа, и для разных платформ требуются разные стратегии анализа.
Одним словом, необходима интеграция ресурсов.
Конечно, каждому просто нужно больше изучать свои темы и совершенствоваться, когда у него есть время. У меня не было этого осознания, когда я учился в аспирантуре, и теперь я до смерти сожалею об этом. среди одноклассников, которые опубликовали статьи с высокими оценками, разрыв становится все больше и больше, и определенно не будет паникерством сказать, что небольшая ошибка может иметь огромное значение. Я надеюсь, что все воспримут это как предупреждение и не будут тратить время на подготовку к докторской диссертации. Это самое подходящее время для публикации статей.
Теперь, когда все выполняют HD и Stereo-seq, постарайтесь не использовать режим сегментации ячеек, а использовать режим сегментации изображений для распознавания изображений, чтобы получить пространственную матрицу уровня одной ячейки.
Сегодня мы продолжаем совершенствовать процесс анализа, уделяя особое внимание BGI (Stereo-seq).
iTME, который рассекает ткани клеточного окружения (CN) на основе клеточного состава
Большая часть программного обеспечения с открытым исходным кодом для анализа межклеточных связей разработана на основе экспрессии генов или расстояния между клетками без учета расстояния межклеточного взаимодействия.
Выявление глубокой пространственной ковариации межклеточной коммуникации, вызванной гетерогенным пространственным ТМЭ.
Структура анализа
1. Сначала выполните анализ соседства ячеек. 2. Анализировать пространственное взаимодействие между клетками и обнаруживать активные пары L-R путем количественного определения пространственной близости и силы взаимодействия между клетками и генами. 3. Построить метамодули TME на основе нескольких образцов и в то же время проанализировать модули пространственного взаимодействия, связанные с этими модулями TME и метамодулями.


Декодирование iTME в организационные единицы клеточного окружения (CN)


Сила пространственного взаимодействия ячеек: вывод о пространственной связи между ячейками


Профилирование микроокружения опухоли с помощью пространственной транскриптомики


Тканевые клеточные районы, связанные с TME


Деконволюция iTME для одной нейронной сети

Пример кода
git clone https://github.com/STOmics/SCIITensor.git

cd SCIITensor

python setup.py install
Single sample analysis
import SCIITensor as sct
import scanpy as sc
import pandas as pd
import seaborn as sns
import matplotlib as mpl
import matplotlib.pyplot as plt
import pickle

adata = sc.read("/data/work/LR_TME/Liver/LC5M/sp.h5ad")
lc5m = sct.core.scii_tensor.InteractionTensor(adata, interactionDB="/data/work/database/LR/cellphoneDB_interactions_add_SAA1.csv")
sct.core.scii_tensor.build_SCII(lc5m)
sct.core.scii_tensor.process_SCII(lc5m, bin_zero_remove=True, log_data=True)
sct.core.scii_tensor.eval_SCII_rank(lc5m)
sct.core.scii_tensor.SCII_Tensor(lc5m)
with open("LC5M_res.pkl", "wb") as f:
    pickle.dump(lc5m, f)


# Visualization
## heatmap
sct.core.scii_tensor.plot_tme_mean_intensity(lc5m, tme_module = 0, cellpair_module = 2, lrpair_module = 4,
    n_lr = 15, n_cc = 5,
    figsize = (10, 2), save = False, size = 2, vmax=1)
factor_cc = lc5m.cc_factor.copy()
factor_cc.columns = factor_cc.columns.map(lambda x: f"CC_Module {x}")

factor_lr = lc5m.lr_factor.copy()
factor_lr.columns = factor_lr.columns.map(lambda x: f"LR_Module {x}")

factor_tme = pd.DataFrame(lc5m.factors[2])
factor_tme.columns = factor_tme.columns.map(lambda x: f"TME {x}")

#draw the heatmap based on the cell-cell factor matrix
fig = sns.clustermap(factor_cc.T, cmap="Purples", standard_scale=0, metric='euclidean', method='ward',
                     row_cluster=False, dendrogram_ratio=0.05, cbar_pos=(1.02, 0.6, 0.01, 0.3),
                     figsize=(24, 10),
                     )
fig.savefig("./factor_cc_heatmap.pdf")

#select the top ligand-receptor pairs, then draw the heatmap based on ligan-receptor factor matrix
lr_number = 120 #number of ligand-receptor pairs on the top that will remain
factor_lr_top = factor_lr.loc[factor_lr.sum(axis=1).sort_values(ascending=False).index[0:lr_number]]
fig = sns.clustermap(factor_lr_top.T, cmap="Purples", standard_scale=0, metric='euclidean', method='ward',
                     row_cluster=False, dendrogram_ratio=0.05, cbar_pos=(1.02, 0.6, 0.01, 0.3),
                     figsize=(28, 10),
                     )
fig.savefig("./factor_lr_heatmap.pdf")

## sankey
core_df = sct.plot.sankey.core_process(lc5m.core)
sct.plot.sankey.sankey_3d(core_df, link_alpha=0.5, interval=0.001, save="sankey_3d.pdf")

## circles
interaction_matrix = sct.plot.scii_circos.interaction_select(lc5m.lr_mt_list, factor_cc, factor_lr, factor_tme,
                               interest_TME='TME 0',
                               interest_cc_module='CC_Module 3',
                               interest_LR_module='LR_Module 4',
                               lr_number=20,
                               cc_number=10)

plt.figure(figsize=(8, 3))
sns.heatmap(interaction_matrix, vmax=1)

#Draw the circos diagram, which includes cell types, ligand-receptor genes, and the links between ligands and receptors.
cells = ['Hepatocyte', 'Fibroblast', 'Cholangiocyte', 'Endothelial', 'Macrophage', 'Malignant', 'B_cell', 'T_cell', 'DC', 'NK'] #list contains names of all cell types
sct.plot.scii_circos.cells_lr_circos(interaction_matrix, cells, save="cells_lr_circos.pdf")

#Draw the circos which only contains cell types and the links between them.
sct.plot.scii_circos.cells_circos(interaction_matrix, cells, save="cells_circos.pdf")

#Draw circos which only contains ligand-receptor genes
sct.plot.scii_circos.lr_circos(interaction_matrix, cells)

## igraph
sct.plot.scii_net.grap_plot(interaction_matrix, cells,
                   save="igrap_network.pdf")

cc_df = sankey.factor_process(lc5m.factors[0], lc5m.cellpair)
sct.plot.sankey.sankey_2d(cc_df)
Multiple sample analysis
adata_LC5P = sc.read("/data/work/LR_TME/Liver/LC5P/FE1/cell2location_map/sp.h5ad")
lc5p = sct.core.scii_tensor.InteractionTensor(adata_LC5P, interactionDB="/data/work/database/LR/cellphoneDB_interactions_add_SAA1.csv")
sct.core.scii_tensor.build_SCII(lc5p)
sct.core.scii_tensor.process_SCII(lc5p)
sct.core.scii_tensor.eval_SCII_rank(lc5p)
sct.core.scii_tensor.SCII_Tensor(lc5p)
with open('LC5P_res.pkl', "wb") as f:
    pickle.dump(lc5p, f)


adata_LC5T = sc.read("/data/work/LR_TME/Liver/LC5T/FD3/cell2location_map/sp.h5ad")
lc5t = sct.core.scii_tensor.InteractionTensor(adata_LC5T, interactionDB="/data/work/database/LR/cellphoneDB_interactions_add_SAA1.csv")
sct.core.scii_tensor.build_SCII(lc5t)
sct.core.scii_tensor.process_SCII(lc5t)
sct.core.scii_tensor.eval_SCII_rank(lc5t)
sct.core.scii_tensor.SCII_Tensor(lc5t)
with open('LC5T_res.pkl', "wb") as f:
    pickle.dump(lc5t, f)

## merge data
all_data = sct.core.scii_tensor.merge_data([lc5t, lc5m, lc5p], patient_id = ['LC5T', 'LC5M', 'LC5P'])
sct.core.scii_tensor.SCII_Tensor_multiple(all_data)

## heatmap
mpl.rcParams.update(mpl.rcParamsDefault)
sct.core.scii_tensor.plot_tme_mean_intensity_multiple(all_data, sample='LC5T',
                                                     tme_module=0, cellpair_module=0, lrpair_module=0, vmax=1)
Пример кодасуществоватьGitHub - STOmics/SCIITensor
Жизнь хороша, с тобой еще лучше
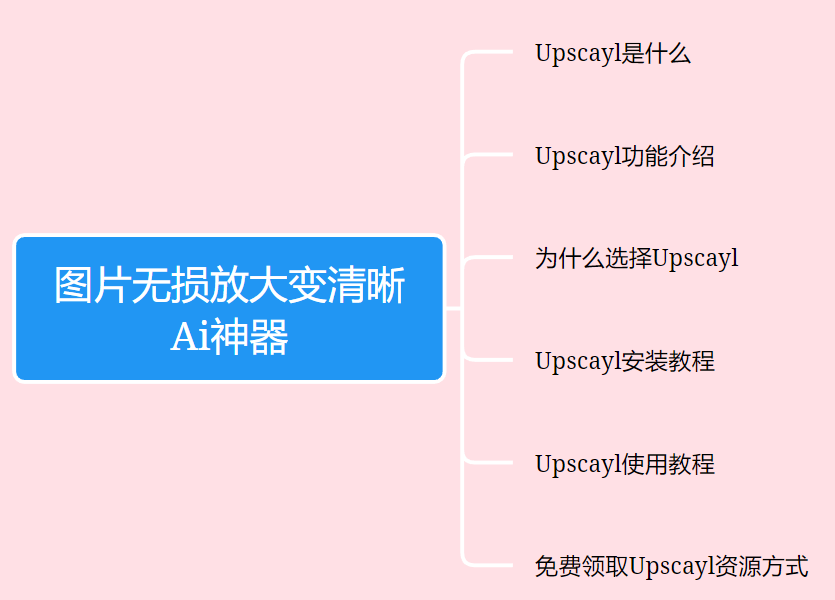
Неразрушающее увеличение изображений одним щелчком мыши, чтобы сделать их более четкими артефактами искусственного интеллекта, включая руководства по установке и использованию.
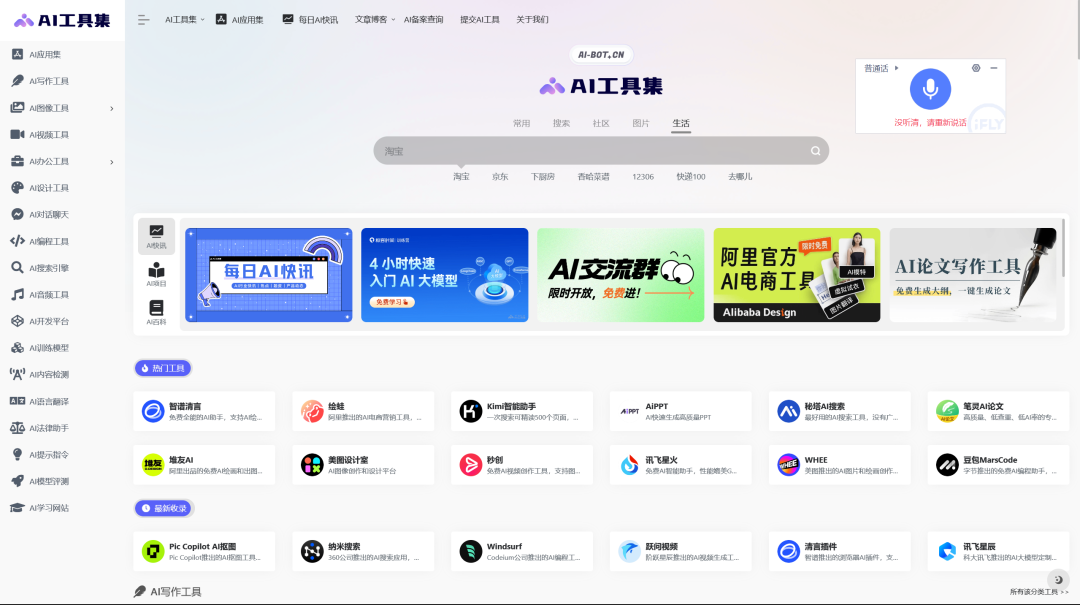
Копикодер: этот инструмент отлично работает с Cursor, Bolt и V0! Предоставьте более качественные подсказки для разработки интерфейса (создание навигационного веб-сайта с использованием искусственного интеллекта).
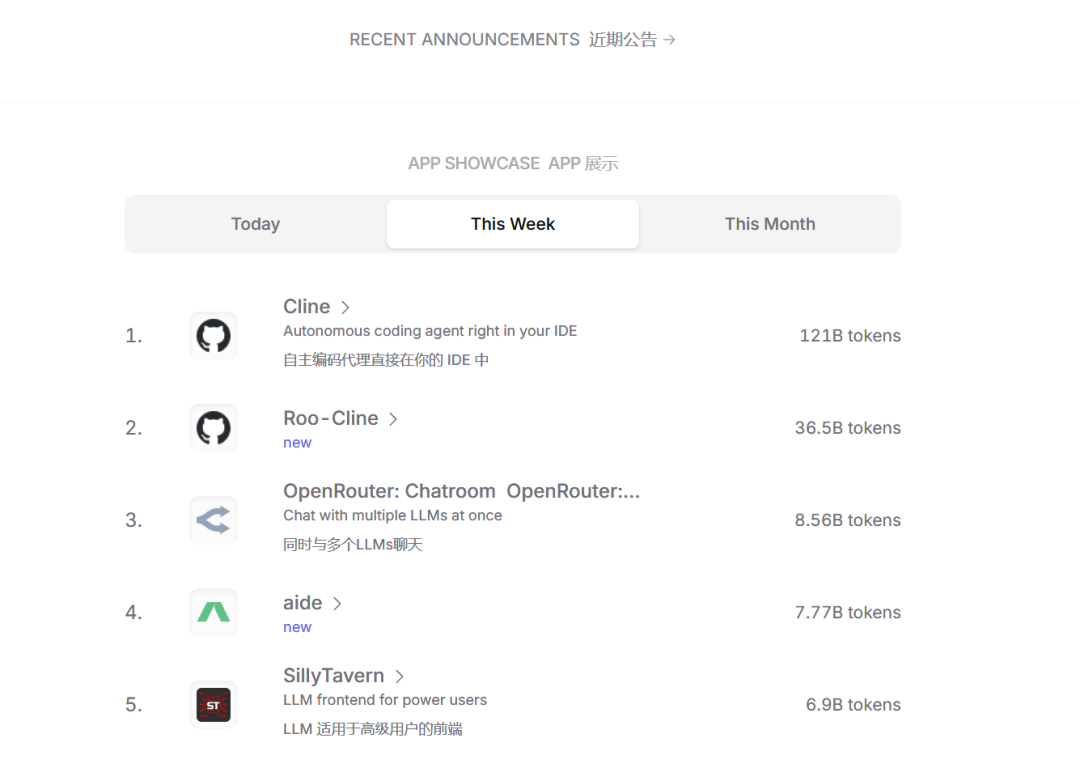
Новый бесплатный RooCline превосходит Cline v3.1? ! Быстрее, умнее и лучше вилка Cline! (Независимое программирование AI, порог 0)

Разработав более 10 проектов с помощью Cursor, я собрал 10 примеров и 60 подсказок.
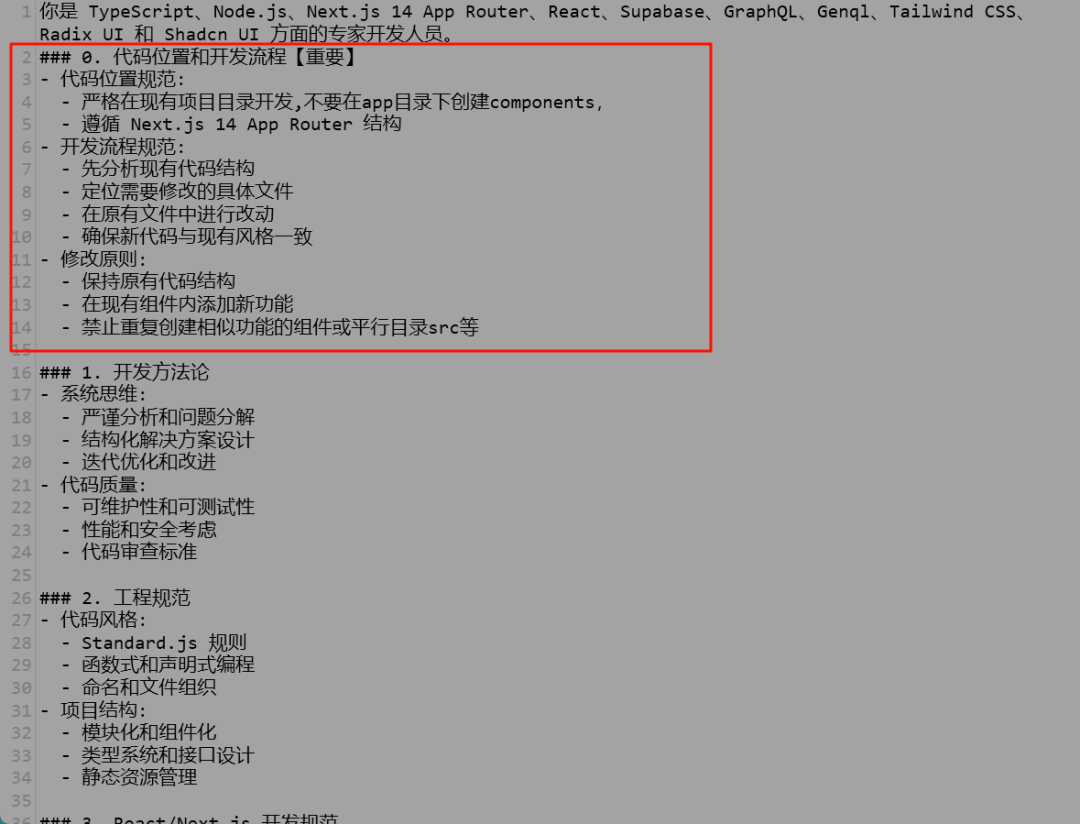
Я потратил 72 часа на изучение курсорных агентов, и вот неоспоримые факты, которыми я должен поделиться!
Идеальная интеграция Cursor и DeepSeek API

DeepSeek V3 снижает затраты на обучение больших моделей
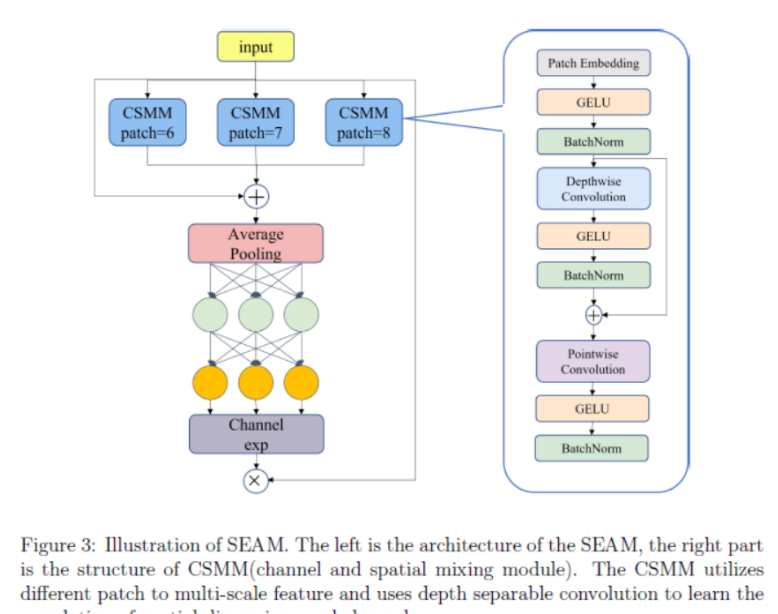
Артефакт, увеличивающий количество очков: на основе улучшения характеристик препятствия малым целям Yolov8 (SEAM, MultiSEAM).
DeepSeek V3 раскручивался уже три дня. Сегодня я попробовал самопровозглашенную модель «ChatGPT».

Open Devin — инженер-программист искусственного интеллекта с открытым исходным кодом, который меньше программирует и больше создает.
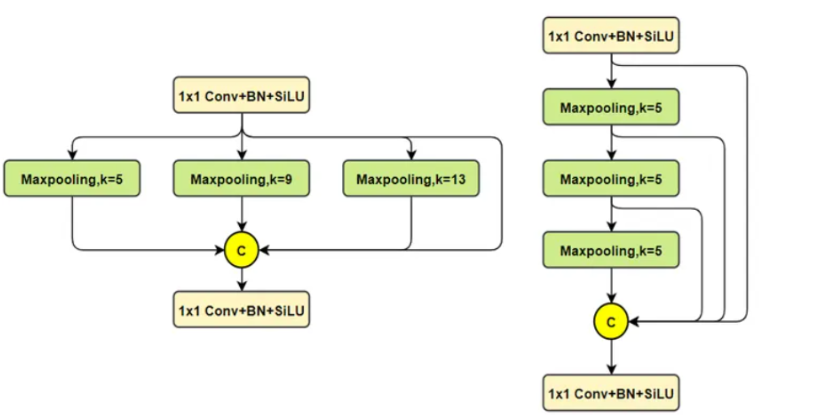
Эксклюзивное оригинальное улучшение YOLOv8: собственная разработка SPPF | SPPF сочетается с воспринимаемой большой сверткой ядра UniRepLK, а свертка с большим ядром + без расширения улучшает восприимчивое поле

Популярное и подробное объяснение DeepSeek-V3: от его появления до преимуществ и сравнения с GPT-4o.

9 основных словесных инструкций по доработке академических работ с помощью ChatGPT, эффективных и практичных, которые стоит собрать

Вызовите deepseek в vscode для реализации программирования с помощью искусственного интеллекта.

Познакомьтесь с принципами сверточных нейронных сетей (CNN) в одной статье (суперподробно)
50,3 тыс. звезд! Immich: автономное решение для резервного копирования фотографий и видео, которое экономит деньги и избавляет от беспокойства.
Cloud Native|Практика: установка Dashbaord для K8s, графика неплохая
Краткий обзор статьи — использование синтетических данных при обучении больших моделей и оптимизации производительности
MiniPerplx: новая поисковая система искусственного интеллекта с открытым исходным кодом, спонсируемая xAI и Vercel.
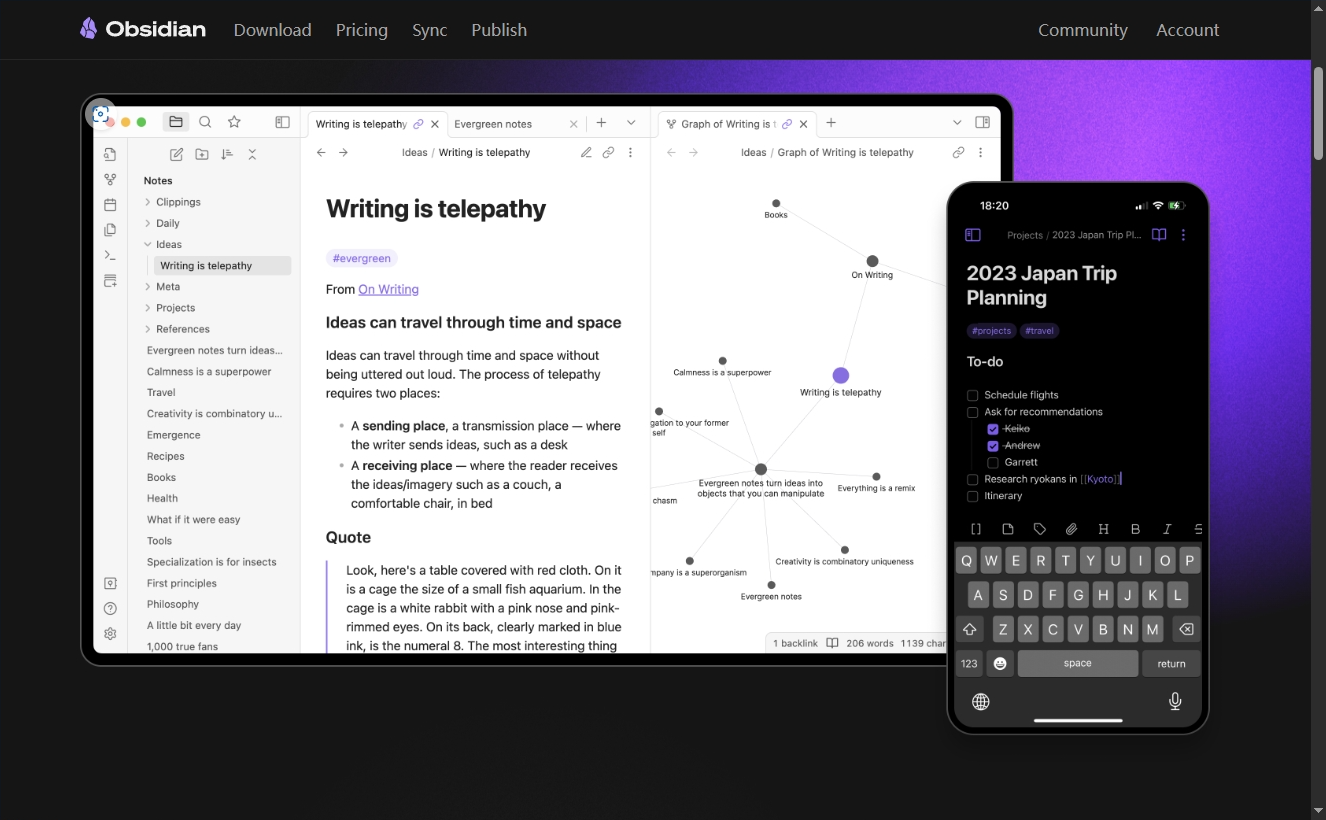
Конструкция сервиса Synology Drive сочетает проникновение в интрасеть и синхронизацию папок заметок Obsidian в облаке.
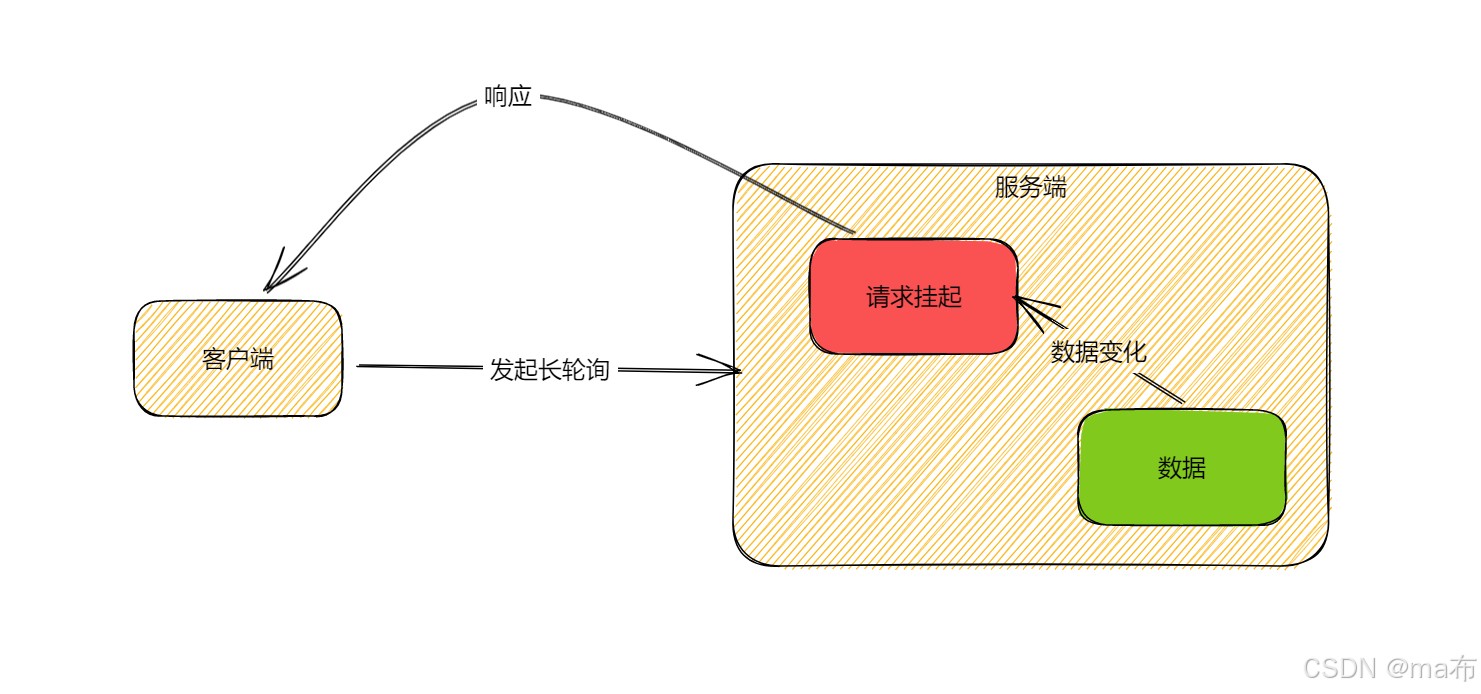
Центр конфигурации————Накос
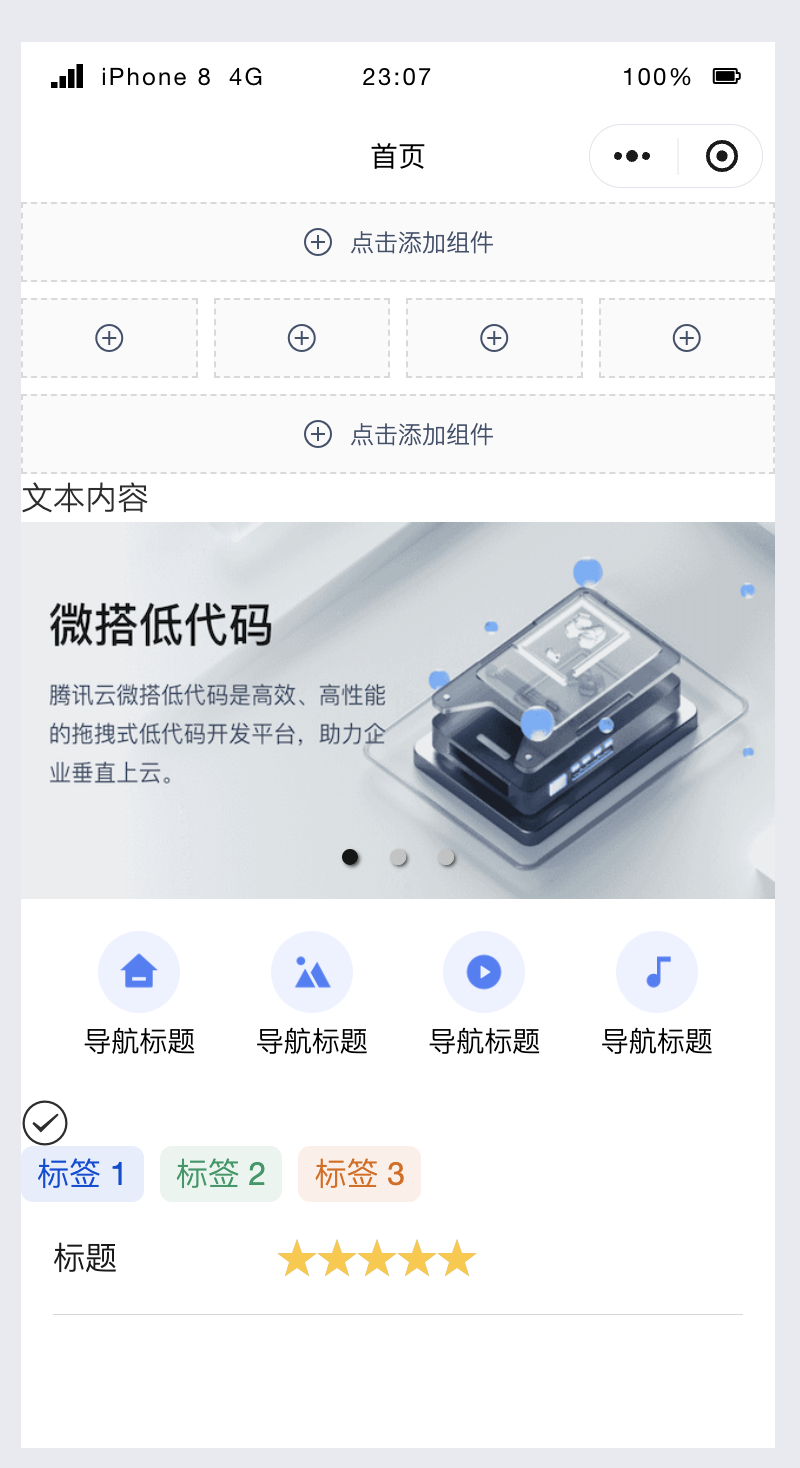
Начинаем с нуля при разработке в облаке Copilot: начать разработку с минимальным использованием кода стало проще

[Серия Docker] Docker создает мультиплатформенные образы: практика архитектуры Arm64
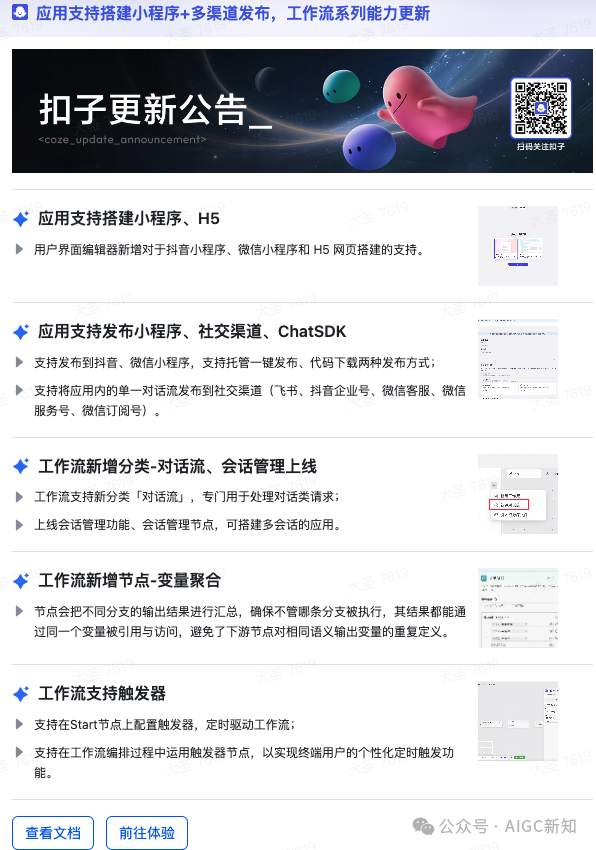
Обновление новых возможностей coze | Я использовал coze для создания апплета помощника по исправлению домашних заданий по математике

Советы по развертыванию Nginx: практическое создание статических веб-сайтов на облачных серверах
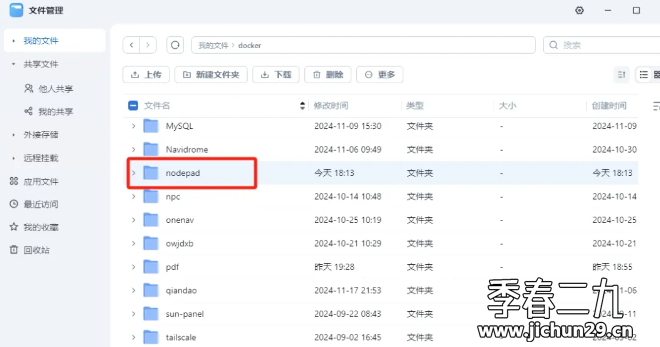
Feiniu fnos использует Docker для развертывания личного блокнота Notepad

Сверточная нейронная сеть VGG реализует классификацию изображений Cifar10 — практический опыт Pytorch
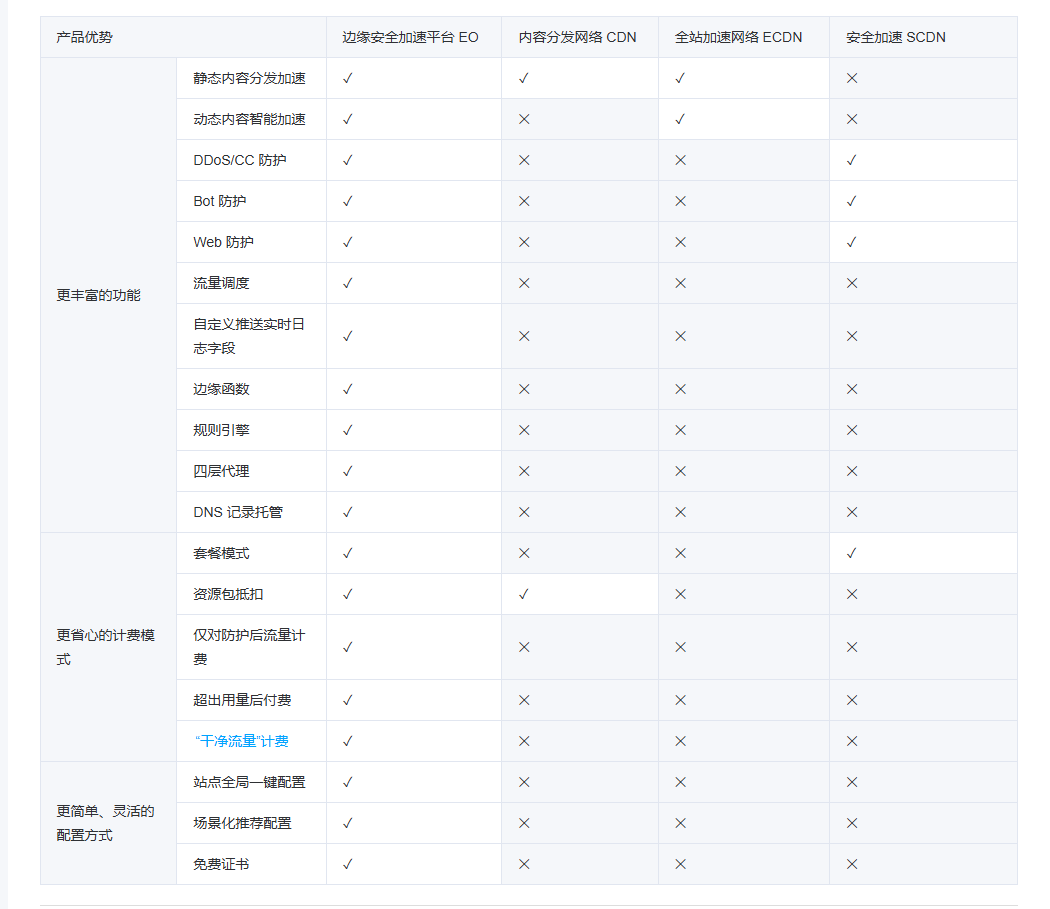
Начало работы с EdgeonePages — новым недорогим решением для хостинга веб-сайтов
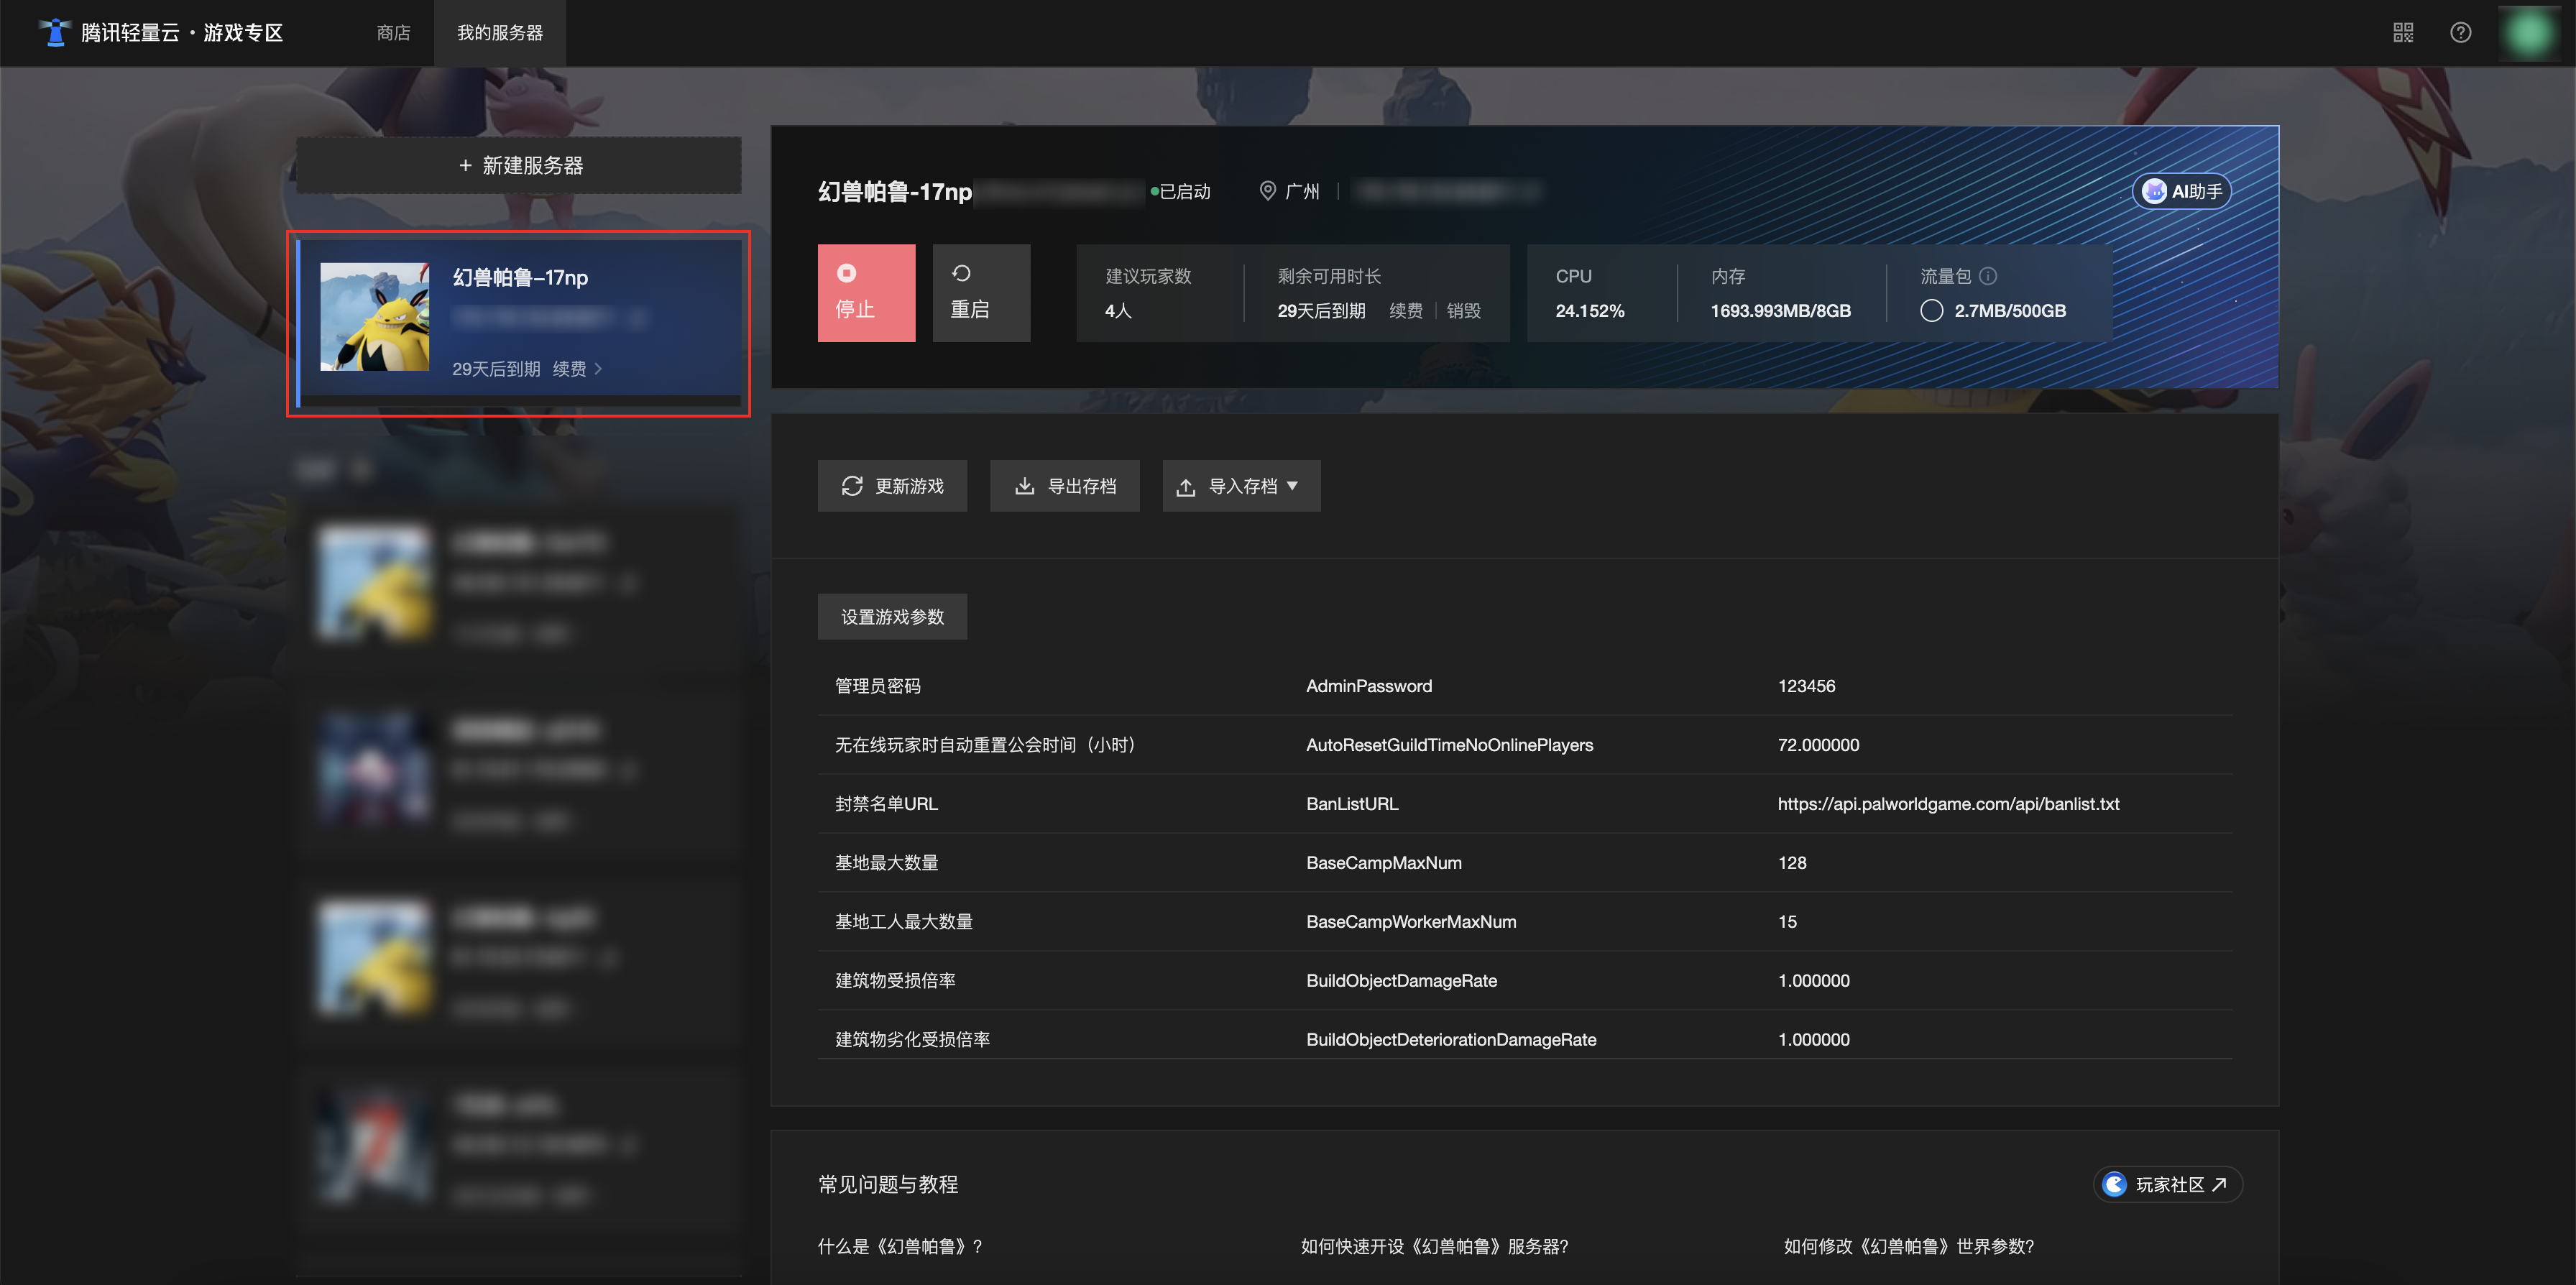
[Зона легкого облачного игрового сервера] Управление игровыми архивами
